A common request when building a Tableau dashboard is to have the dashboard default to a specific time frame (e.g. yesterday or the last 7 days), but also allow for the ability to select a custom date range. This post focuses on how to build this functionality.
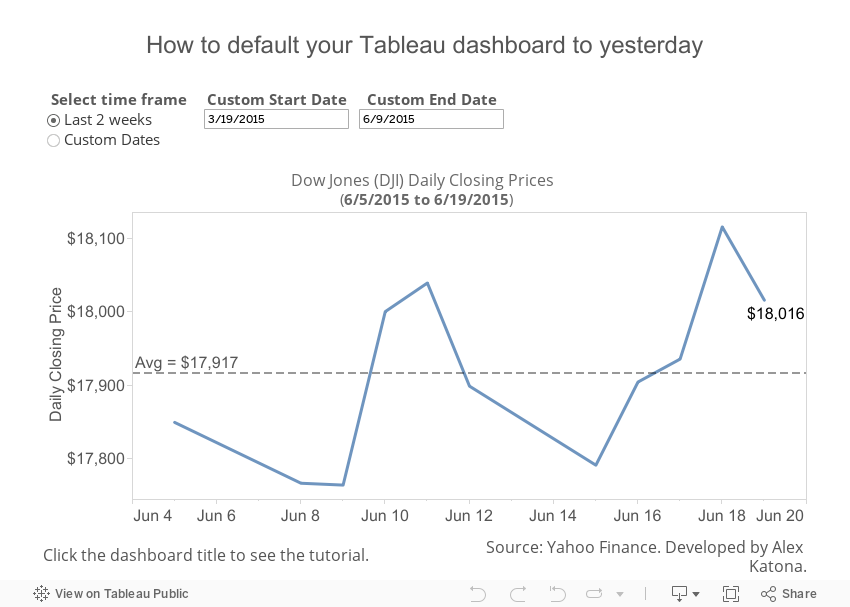
The example dashboard below visualizes the closing stock price of the Dow Jones (DJI) on a daily basis. The time frame defaults to the last 2 weeks based on the latest date of the dataset (i.e. 6/19/15). When the user selects "Custom Dates," the custom date parameters will apply to the data (my Next Level Popping Parameters series discusses how to hide these parameters until they are needed). If you have Tableau Desktop, you may want to download this workbook from Tableau Public to follow the steps below. Otherwise, I've included screenshots in the steps.
Step 1: Create a Date Selection Parameter using the following settings:

An integer data type with aliases for the display is used instead of a string parameter because calculations are more performant using integers instead of strings. I usually use 1 and 2 as the result of if statements in calculated fields that use parameters (like in Step 3) so that is why I'm using 3 and 4 in the parameter values in order to reduce confusion.
Step 2: Create the Custom Start Date and Custom End Date parameters

Step 3: Create the Date Selection Parameter Calculation

You can remove the "minus 14" if you would like to have your dashboard default to the max date or you can adjust the number of days based on your requirements.This calculation is possible because the level of detail calculation (LOD) allows you to combine aggregate and non-aggregate arguments. Make sure that the "minus 14" is outside of the curly braces of the LOD calc.
Step 4: Convert the Date Selection Parameter Calculation to a discrete dimension by right clicking on the field or clicking and dragging it to the dimension area in the data pane. Then, drag the Date Selection Parameter Calculation to the Filters shelf and filter for 1. You could also add this as a Data Source filter instead to increase performance, but you should verify that doing this will not unintentionally affect other filters or worksheets.

Step 5: Right click on the parameters to show the parameter controls on the worksheet. You can do this quickly by clicking the top parameter, holding shift, selecting the bottom parameter, and then right clicking to "Show Parameter Control." Then, add the worksheet to a dashboard to automatically add the parameters to the dashboard. Edit the titles of the parameters if necessary.


In summary: 3 parameters and 1 calculation to default your dashboard to a specific time frame and allow for the ability to select custom dates.
This method works, but the user needs to know to select Custom Dates on the “Select time frame” parameter before the Custom Date parameters are applied to the data. This can cause confusion for users. Please refer to my series Next Level Popping Parameters to learn more about how to prevent this and improve the user experience (as demonstrated below):